|
Download Data (XLS File) |
|
|||||
|
|||||
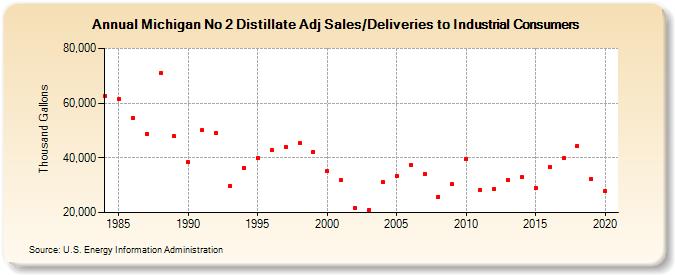
| Michigan No 2 Distillate Adj Sales/Deliveries to Industrial Consumers (Thousand Gallons) | |||||
| Decade | Year-0 | Year-1 | Year-2 | Year-3 | Year-4 | Year-5 | Year-6 | Year-7 | Year-8 | Year-9 |
|---|---|---|---|---|---|---|---|---|---|---|
| 1980's | 62,535 | 61,591 | 54,518 | 48,717 | 70,948 | 47,882 | ||||
| 1990's | 38,462 | 50,066 | 48,970 | 29,846 | 36,464 | 39,888 | 42,754 | 44,063 | 45,313 | 42,229 |
| 2000's | 35,091 | 31,740 | 21,684 | 20,876 | 31,084 | 33,418 | 37,446 | 34,211 | 25,779 | 30,295 |
| 2010's | 39,727 | 28,379 | 28,524 | 32,073 | 32,844 | 28,990 | 36,781 | 39,846 | 44,321 | 32,245 |
| 2020's | 27,831 |
| - = No Data Reported; -- = Not Applicable; NA = Not Available; W = Withheld to avoid disclosure of individual company data. |
| Release Date: 2/9/2022 |
| Next Release Date: Suspended |