|
Download Data (XLS File) |
|
|||||
|
|||||
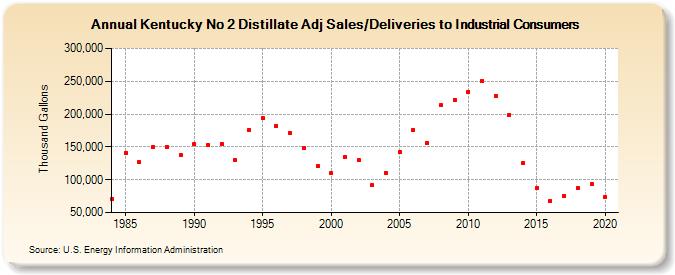
| Kentucky No 2 Distillate Adj Sales/Deliveries to Industrial Consumers (Thousand Gallons) | |||||
| Decade | Year-0 | Year-1 | Year-2 | Year-3 | Year-4 | Year-5 | Year-6 | Year-7 | Year-8 | Year-9 |
|---|---|---|---|---|---|---|---|---|---|---|
| 1980's | 70,073 | 141,343 | 126,379 | 149,891 | 150,406 | 137,695 | ||||
| 1990's | 154,020 | 152,476 | 155,110 | 129,614 | 175,995 | 193,875 | 182,549 | 171,434 | 148,928 | 120,677 |
| 2000's | 110,179 | 134,388 | 129,866 | 91,337 | 110,388 | 142,044 | 176,036 | 155,891 | 213,282 | 222,159 |
| 2010's | 233,978 | 251,084 | 228,126 | 199,310 | 125,635 | 87,088 | 67,667 | 75,234 | 87,110 | 93,263 |
| 2020's | 74,034 |
| - = No Data Reported; -- = Not Applicable; NA = Not Available; W = Withheld to avoid disclosure of individual company data. |
| Release Date: 2/9/2022 |
| Next Release Date: Suspended |