|
Download Data (XLS File) |
|
|||||
|
|||||
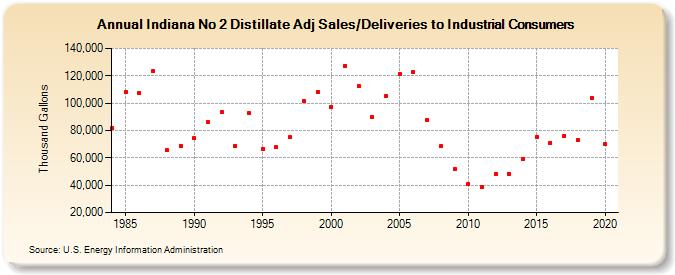
| Indiana No 2 Distillate Adj Sales/Deliveries to Industrial Consumers (Thousand Gallons) | |||||
| Decade | Year-0 | Year-1 | Year-2 | Year-3 | Year-4 | Year-5 | Year-6 | Year-7 | Year-8 | Year-9 |
|---|---|---|---|---|---|---|---|---|---|---|
| 1980's | 81,450 | 108,442 | 107,236 | 123,246 | 65,399 | 68,930 | ||||
| 1990's | 74,298 | 86,304 | 93,642 | 68,908 | 92,671 | 66,438 | 67,726 | 74,951 | 101,690 | 108,159 |
| 2000's | 97,010 | 127,158 | 112,440 | 89,622 | 105,362 | 121,391 | 122,472 | 87,892 | 68,412 | 51,731 |
| 2010's | 40,921 | 38,397 | 48,441 | 48,421 | 59,160 | 75,393 | 71,193 | 76,242 | 72,904 | 103,968 |
| 2020's | 69,953 |
| - = No Data Reported; -- = Not Applicable; NA = Not Available; W = Withheld to avoid disclosure of individual company data. |
| Release Date: 2/9/2022 |
| Next Release Date: Suspended |