|
Download Data (XLS File) |
|
|||||
|
|||||
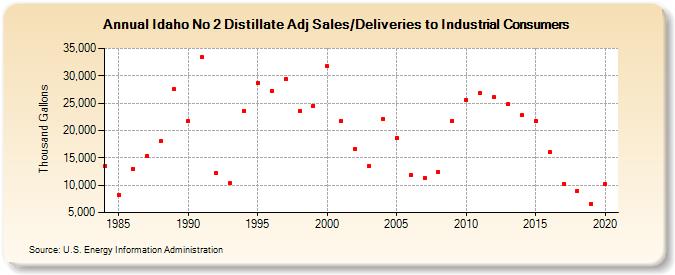
| Idaho No 2 Distillate Adj Sales/Deliveries to Industrial Consumers (Thousand Gallons) | |||||
| Decade | Year-0 | Year-1 | Year-2 | Year-3 | Year-4 | Year-5 | Year-6 | Year-7 | Year-8 | Year-9 |
|---|---|---|---|---|---|---|---|---|---|---|
| 1980's | 13,490 | 8,274 | 13,032 | 15,366 | 18,006 | 27,515 | ||||
| 1990's | 21,674 | 33,343 | 12,168 | 10,326 | 23,617 | 28,684 | 27,275 | 29,383 | 23,535 | 24,533 |
| 2000's | 31,719 | 21,762 | 16,660 | 13,535 | 22,177 | 18,712 | 11,939 | 11,360 | 12,442 | 21,788 |
| 2010's | 25,627 | 26,894 | 26,039 | 24,790 | 22,807 | 21,704 | 15,993 | 10,281 | 8,979 | 6,570 |
| 2020's | 10,174 |
| - = No Data Reported; -- = Not Applicable; NA = Not Available; W = Withheld to avoid disclosure of individual company data. |
| Release Date: 2/9/2022 |
| Next Release Date: Suspended |