|
Download Data (XLS File) |
|
|||||
|
|||||
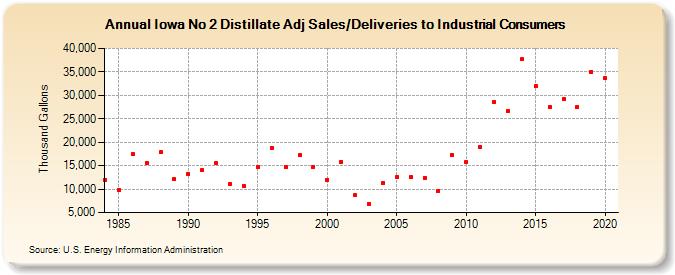
| Iowa No 2 Distillate Adj Sales/Deliveries to Industrial Consumers (Thousand Gallons) | |||||
| Decade | Year-0 | Year-1 | Year-2 | Year-3 | Year-4 | Year-5 | Year-6 | Year-7 | Year-8 | Year-9 |
|---|---|---|---|---|---|---|---|---|---|---|
| 1980's | 12,001 | 9,893 | 17,386 | 15,519 | 17,823 | 12,149 | ||||
| 1990's | 13,325 | 14,111 | 15,553 | 11,115 | 10,635 | 14,722 | 18,834 | 14,795 | 17,237 | 14,769 |
| 2000's | 12,036 | 15,845 | 8,660 | 6,907 | 11,368 | 12,516 | 12,548 | 12,449 | 9,664 | 17,306 |
| 2010's | 15,824 | 18,943 | 28,625 | 26,650 | 37,654 | 31,882 | 27,554 | 29,232 | 27,540 | 35,033 |
| 2020's | 33,622 |
| - = No Data Reported; -- = Not Applicable; NA = Not Available; W = Withheld to avoid disclosure of individual company data. |
| Release Date: 2/9/2022 |
| Next Release Date: Suspended |