|
Download Data (XLS File) |
|
|||||
|
|||||
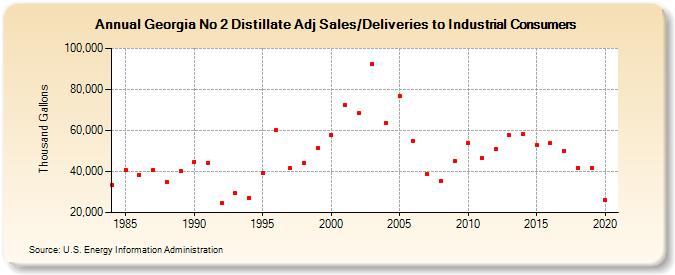
| Georgia No 2 Distillate Adj Sales/Deliveries to Industrial Consumers (Thousand Gallons) | |||||
| Decade | Year-0 | Year-1 | Year-2 | Year-3 | Year-4 | Year-5 | Year-6 | Year-7 | Year-8 | Year-9 |
|---|---|---|---|---|---|---|---|---|---|---|
| 1980's | 33,644 | 40,767 | 38,389 | 40,823 | 35,052 | 40,128 | ||||
| 1990's | 44,814 | 44,394 | 24,660 | 29,393 | 27,218 | 39,132 | 60,079 | 41,485 | 43,924 | 51,687 |
| 2000's | 58,026 | 72,558 | 68,471 | 92,284 | 63,797 | 76,604 | 54,876 | 38,836 | 35,373 | 45,277 |
| 2010's | 53,919 | 46,632 | 50,770 | 57,626 | 58,481 | 53,070 | 53,692 | 50,196 | 41,934 | 41,879 |
| 2020's | 26,054 |
| - = No Data Reported; -- = Not Applicable; NA = Not Available; W = Withheld to avoid disclosure of individual company data. |
| Release Date: 2/9/2022 |
| Next Release Date: Suspended |