|
Download Data (XLS File) |
|
|||||
|
|||||
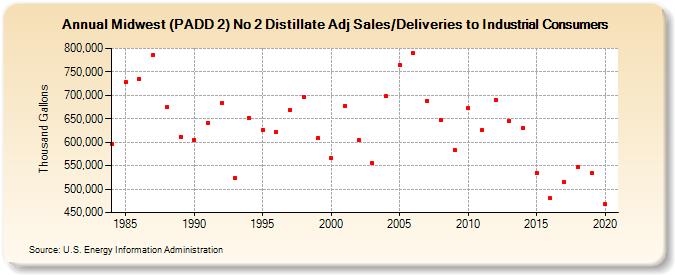
| Midwest (PADD 2) No 2 Distillate Adj Sales/Deliveries to Industrial Consumers (Thousand Gallons) | |||||
| Decade | Year-0 | Year-1 | Year-2 | Year-3 | Year-4 | Year-5 | Year-6 | Year-7 | Year-8 | Year-9 |
|---|---|---|---|---|---|---|---|---|---|---|
| 1980's | 596,846 | 727,720 | 734,830 | 785,853 | 675,829 | 611,989 | ||||
| 1990's | 605,303 | 641,349 | 684,501 | 523,423 | 652,061 | 626,509 | 621,316 | 669,274 | 696,720 | 608,931 |
| 2000's | 565,518 | 677,353 | 603,950 | 556,101 | 697,608 | 765,033 | 789,676 | 688,456 | 648,243 | 584,221 |
| 2010's | 671,938 | 626,338 | 690,279 | 645,382 | 630,237 | 535,078 | 480,092 | 514,955 | 547,660 | 533,665 |
| 2020's | 467,520 |
| - = No Data Reported; -- = Not Applicable; NA = Not Available; W = Withheld to avoid disclosure of individual company data. |
| Release Date: 2/9/2022 |
| Next Release Date: Suspended |