|
Download Data (XLS File) |
|
|||||
|
|||||
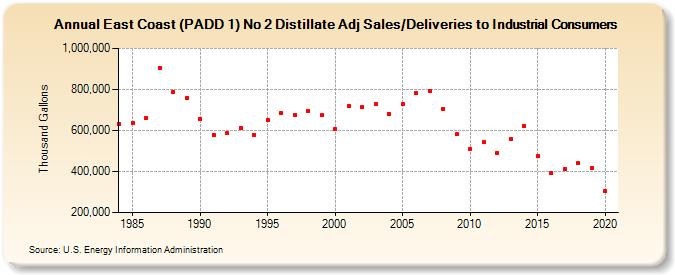
| East Coast (PADD 1) No 2 Distillate Adj Sales/Deliveries to Industrial Consumers (Thousand Gallons) | |||||
| Decade | Year-0 | Year-1 | Year-2 | Year-3 | Year-4 | Year-5 | Year-6 | Year-7 | Year-8 | Year-9 |
|---|---|---|---|---|---|---|---|---|---|---|
| 1980's | 630,300 | 638,151 | 661,707 | 906,599 | 786,245 | 757,320 | ||||
| 1990's | 654,184 | 579,529 | 586,175 | 614,153 | 579,613 | 652,428 | 686,528 | 677,387 | 696,902 | 673,205 |
| 2000's | 607,441 | 719,851 | 712,839 | 726,780 | 680,738 | 729,675 | 784,848 | 791,521 | 706,338 | 582,124 |
| 2010's | 510,303 | 541,521 | 490,253 | 558,048 | 622,304 | 475,923 | 392,098 | 412,589 | 440,814 | 419,517 |
| 2020's | 303,846 |
| - = No Data Reported; -- = Not Applicable; NA = Not Available; W = Withheld to avoid disclosure of individual company data. |
| Release Date: 2/9/2022 |
| Next Release Date: Suspended |