|
Download Data (XLS File) |
|
|||||
|
|||||
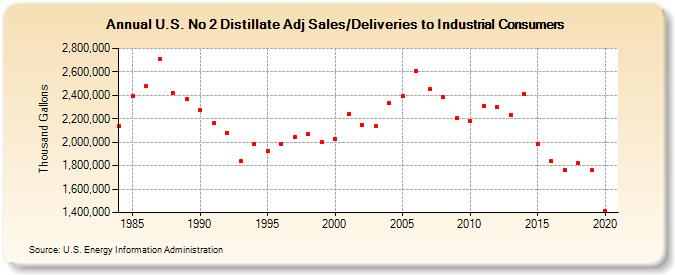
| U.S. No 2 Distillate Adj Sales/Deliveries to Industrial Consumers (Thousand Gallons) | |||||
| Decade | Year-0 | Year-1 | Year-2 | Year-3 | Year-4 | Year-5 | Year-6 | Year-7 | Year-8 | Year-9 |
|---|---|---|---|---|---|---|---|---|---|---|
| 1980's | 2,135,100 | 2,392,078 | 2,476,955 | 2,710,557 | 2,421,888 | 2,365,392 | ||||
| 1990's | 2,276,918 | 2,165,604 | 2,082,507 | 1,839,144 | 1,981,725 | 1,926,187 | 1,988,840 | 2,046,632 | 2,071,643 | 1,999,279 |
| 2000's | 2,025,296 | 2,241,035 | 2,149,881 | 2,137,184 | 2,330,751 | 2,395,056 | 2,610,130 | 2,455,690 | 2,388,889 | 2,205,442 |
| 2010's | 2,180,180 | 2,312,610 | 2,299,450 | 2,234,610 | 2,410,998 | 1,984,363 | 1,836,537 | 1,765,815 | 1,826,274 | 1,763,993 |
| 2020's | 1,411,571 |
| - = No Data Reported; -- = Not Applicable; NA = Not Available; W = Withheld to avoid disclosure of individual company data. |
| Release Date: 2/9/2022 |
| Next Release Date: Suspended |