|
Download Data (XLS File) |
|
|||||
|
|||||
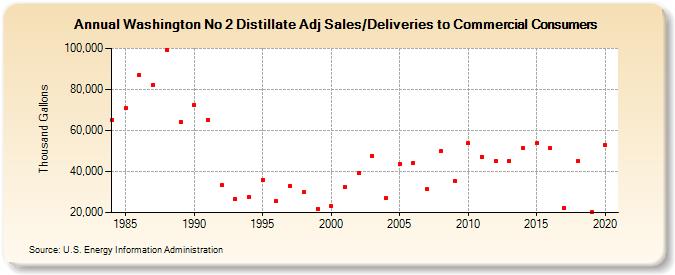
| Washington No 2 Distillate Adj Sales/Deliveries to Commercial Consumers (Thousand Gallons) | |||||
| Decade | Year-0 | Year-1 | Year-2 | Year-3 | Year-4 | Year-5 | Year-6 | Year-7 | Year-8 | Year-9 |
|---|---|---|---|---|---|---|---|---|---|---|
| 1980's | 65,000 | 70,879 | 87,062 | 82,371 | 99,207 | 64,145 | ||||
| 1990's | 72,528 | 65,253 | 33,191 | 26,502 | 27,441 | 36,109 | 25,596 | 33,110 | 30,029 | 21,891 |
| 2000's | 22,997 | 32,579 | 39,309 | 47,588 | 27,184 | 43,636 | 44,338 | 31,310 | 49,776 | 35,264 |
| 2010's | 53,705 | 47,220 | 45,154 | 45,051 | 51,333 | 53,761 | 51,446 | 22,374 | 45,197 | 20,093 |
| 2020's | 52,811 |
| - = No Data Reported; -- = Not Applicable; NA = Not Available; W = Withheld to avoid disclosure of individual company data. |
| Release Date: 2/9/2022 |
| Next Release Date: Suspended |