|
Download Data (XLS File) |
|
|||||
|
|||||
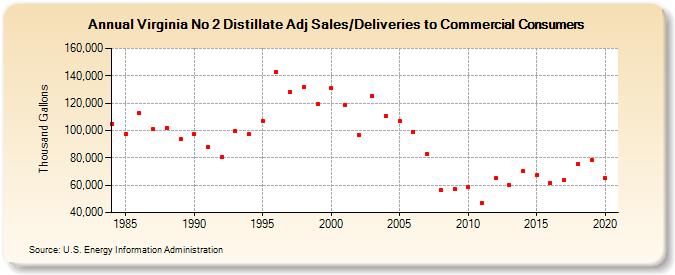
| Virginia No 2 Distillate Adj Sales/Deliveries to Commercial Consumers (Thousand Gallons) | |||||
| Decade | Year-0 | Year-1 | Year-2 | Year-3 | Year-4 | Year-5 | Year-6 | Year-7 | Year-8 | Year-9 |
|---|---|---|---|---|---|---|---|---|---|---|
| 1980's | 104,572 | 97,337 | 112,892 | 100,944 | 102,165 | 93,666 | ||||
| 1990's | 97,679 | 87,677 | 80,503 | 99,534 | 97,219 | 107,266 | 142,924 | 128,223 | 131,732 | 119,592 |
| 2000's | 130,719 | 118,859 | 96,978 | 125,419 | 110,429 | 106,968 | 98,885 | 82,743 | 56,515 | 57,365 |
| 2010's | 58,354 | 47,026 | 64,981 | 60,077 | 70,324 | 67,139 | 61,685 | 63,452 | 75,310 | 78,589 |
| 2020's | 64,970 |
| - = No Data Reported; -- = Not Applicable; NA = Not Available; W = Withheld to avoid disclosure of individual company data. |
| Release Date: 2/9/2022 |
| Next Release Date: Suspended |