|
Download Data (XLS File) |
|
|||||
|
|||||
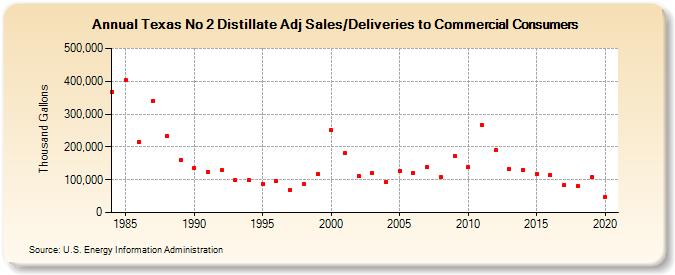
| Texas No 2 Distillate Adj Sales/Deliveries to Commercial Consumers (Thousand Gallons) | |||||
| Decade | Year-0 | Year-1 | Year-2 | Year-3 | Year-4 | Year-5 | Year-6 | Year-7 | Year-8 | Year-9 |
|---|---|---|---|---|---|---|---|---|---|---|
| 1980's | 367,890 | 402,448 | 215,124 | 340,604 | 232,548 | 160,599 | ||||
| 1990's | 136,799 | 123,785 | 129,813 | 97,960 | 97,907 | 86,372 | 95,938 | 68,942 | 86,511 | 117,120 |
| 2000's | 250,491 | 180,110 | 111,201 | 119,591 | 93,570 | 125,445 | 121,702 | 137,328 | 109,009 | 171,712 |
| 2010's | 139,025 | 266,691 | 190,340 | 132,521 | 130,872 | 117,669 | 113,898 | 84,589 | 81,625 | 106,826 |
| 2020's | 46,483 |
| - = No Data Reported; -- = Not Applicable; NA = Not Available; W = Withheld to avoid disclosure of individual company data. |
| Release Date: 2/9/2022 |
| Next Release Date: Suspended |