|
Download Data (XLS File) |
|
|||||
|
|||||
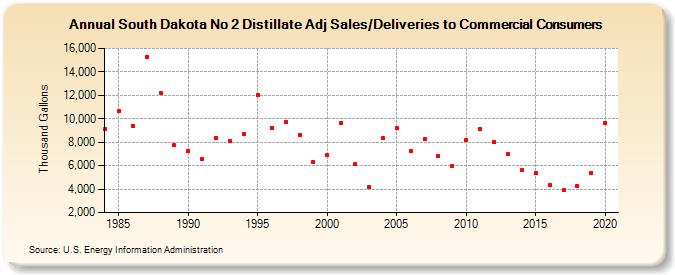
| South Dakota No 2 Distillate Adj Sales/Deliveries to Commercial Consumers (Thousand Gallons) | |||||
| Decade | Year-0 | Year-1 | Year-2 | Year-3 | Year-4 | Year-5 | Year-6 | Year-7 | Year-8 | Year-9 |
|---|---|---|---|---|---|---|---|---|---|---|
| 1980's | 9,137 | 10,657 | 9,410 | 15,272 | 12,217 | 7,741 | ||||
| 1990's | 7,246 | 6,580 | 8,349 | 8,107 | 8,735 | 12,028 | 9,211 | 9,749 | 8,579 | 6,341 |
| 2000's | 6,927 | 9,666 | 6,102 | 4,184 | 8,390 | 9,215 | 7,279 | 8,279 | 6,798 | 5,978 |
| 2010's | 8,207 | 9,150 | 8,028 | 6,978 | 5,598 | 5,367 | 4,386 | 3,890 | 4,295 | 5,402 |
| 2020's | 9,620 |
| - = No Data Reported; -- = Not Applicable; NA = Not Available; W = Withheld to avoid disclosure of individual company data. |
| Release Date: 2/9/2022 |
| Next Release Date: Suspended |