|
Download Data (XLS File) |
|
|||||
|
|||||
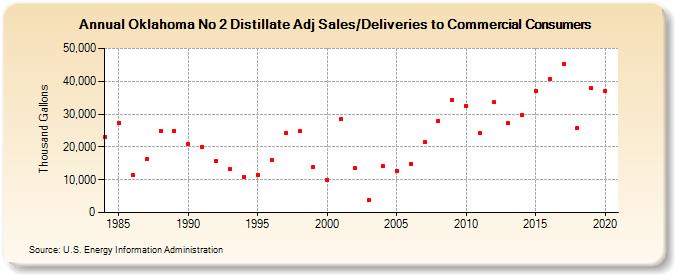
| Oklahoma No 2 Distillate Adj Sales/Deliveries to Commercial Consumers (Thousand Gallons) | |||||
| Decade | Year-0 | Year-1 | Year-2 | Year-3 | Year-4 | Year-5 | Year-6 | Year-7 | Year-8 | Year-9 |
|---|---|---|---|---|---|---|---|---|---|---|
| 1980's | 23,165 | 27,395 | 11,305 | 16,206 | 24,881 | 24,968 | ||||
| 1990's | 20,908 | 20,080 | 15,595 | 13,256 | 10,936 | 11,553 | 15,933 | 24,184 | 24,828 | 13,774 |
| 2000's | 9,938 | 28,573 | 13,466 | 3,763 | 14,046 | 12,749 | 14,903 | 21,455 | 27,960 | 34,402 |
| 2010's | 32,461 | 24,303 | 33,532 | 27,193 | 29,672 | 37,020 | 40,673 | 45,377 | 25,812 | 37,827 |
| 2020's | 37,094 |
| - = No Data Reported; -- = Not Applicable; NA = Not Available; W = Withheld to avoid disclosure of individual company data. |
| Release Date: 2/9/2022 |
| Next Release Date: Suspended |