|
Download Data (XLS File) |
|
|||||
|
|||||
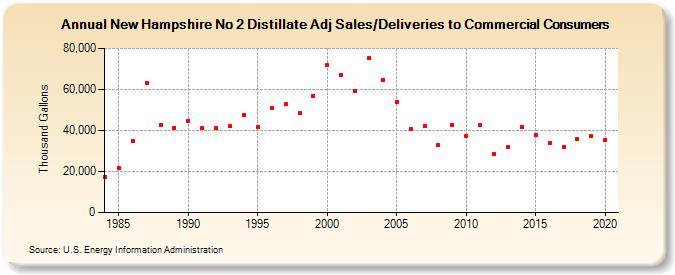
| New Hampshire No 2 Distillate Adj Sales/Deliveries to Commercial Consumers (Thousand Gallons) | |||||
| Decade | Year-0 | Year-1 | Year-2 | Year-3 | Year-4 | Year-5 | Year-6 | Year-7 | Year-8 | Year-9 |
|---|---|---|---|---|---|---|---|---|---|---|
| 1980's | 17,156 | 21,563 | 35,029 | 63,170 | 42,820 | 41,371 | ||||
| 1990's | 44,675 | 41,095 | 41,004 | 41,965 | 47,727 | 41,836 | 50,815 | 52,750 | 48,467 | 56,946 |
| 2000's | 71,663 | 67,082 | 59,075 | 75,291 | 64,525 | 53,850 | 40,611 | 42,149 | 32,999 | 42,567 |
| 2010's | 37,213 | 42,605 | 28,695 | 32,008 | 41,856 | 37,968 | 33,878 | 32,103 | 35,642 | 37,177 |
| 2020's | 35,308 |
| - = No Data Reported; -- = Not Applicable; NA = Not Available; W = Withheld to avoid disclosure of individual company data. |
| Release Date: 2/9/2022 |
| Next Release Date: Suspended |