|
Download Data (XLS File) |
|
|||||
|
|||||
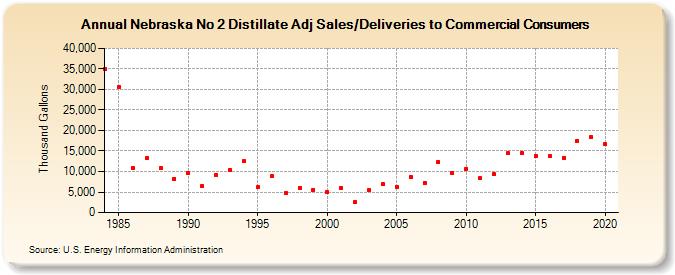
| Nebraska No 2 Distillate Adj Sales/Deliveries to Commercial Consumers (Thousand Gallons) | |||||
| Decade | Year-0 | Year-1 | Year-2 | Year-3 | Year-4 | Year-5 | Year-6 | Year-7 | Year-8 | Year-9 |
|---|---|---|---|---|---|---|---|---|---|---|
| 1980's | 35,090 | 30,593 | 10,932 | 13,227 | 10,813 | 8,287 | ||||
| 1990's | 9,554 | 6,501 | 9,230 | 10,348 | 12,546 | 6,155 | 8,819 | 4,740 | 6,029 | 5,591 |
| 2000's | 5,019 | 6,092 | 2,496 | 5,478 | 6,851 | 6,327 | 8,605 | 7,231 | 12,375 | 9,619 |
| 2010's | 10,672 | 8,384 | 9,290 | 14,414 | 14,513 | 13,768 | 13,667 | 13,371 | 17,457 | 18,367 |
| 2020's | 16,597 |
| - = No Data Reported; -- = Not Applicable; NA = Not Available; W = Withheld to avoid disclosure of individual company data. |
| Release Date: 2/9/2022 |
| Next Release Date: Suspended |