|
Download Data (XLS File) |
|
|||||
|
|||||
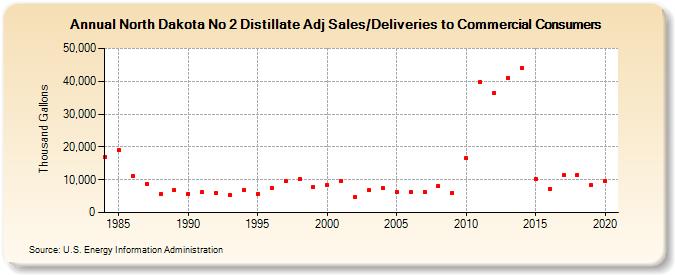
| North Dakota No 2 Distillate Adj Sales/Deliveries to Commercial Consumers (Thousand Gallons) | |||||
| Decade | Year-0 | Year-1 | Year-2 | Year-3 | Year-4 | Year-5 | Year-6 | Year-7 | Year-8 | Year-9 |
|---|---|---|---|---|---|---|---|---|---|---|
| 1980's | 16,994 | 18,962 | 11,186 | 8,819 | 5,643 | 6,856 | ||||
| 1990's | 5,781 | 6,177 | 5,979 | 5,380 | 6,806 | 5,760 | 7,593 | 9,652 | 10,173 | 7,797 |
| 2000's | 8,357 | 9,757 | 4,612 | 6,780 | 7,349 | 6,396 | 6,167 | 6,354 | 8,095 | 6,106 |
| 2010's | 16,536 | 39,732 | 36,465 | 41,122 | 44,037 | 10,309 | 7,323 | 11,319 | 11,488 | 8,346 |
| 2020's | 9,519 |
| - = No Data Reported; -- = Not Applicable; NA = Not Available; W = Withheld to avoid disclosure of individual company data. |
| Release Date: 2/9/2022 |
| Next Release Date: Suspended |