|
Download Data (XLS File) |
|
|||||
|
|||||
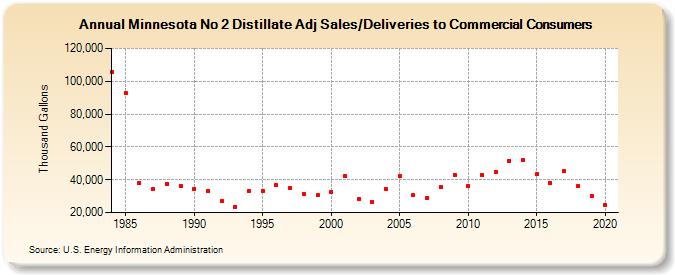
| Minnesota No 2 Distillate Adj Sales/Deliveries to Commercial Consumers (Thousand Gallons) | |||||
| Decade | Year-0 | Year-1 | Year-2 | Year-3 | Year-4 | Year-5 | Year-6 | Year-7 | Year-8 | Year-9 |
|---|---|---|---|---|---|---|---|---|---|---|
| 1980's | 105,552 | 92,818 | 38,095 | 34,487 | 37,502 | 36,432 | ||||
| 1990's | 34,618 | 32,927 | 27,276 | 23,610 | 33,394 | 33,314 | 36,502 | 34,976 | 31,596 | 30,559 |
| 2000's | 32,742 | 42,154 | 28,371 | 26,370 | 34,271 | 41,983 | 30,437 | 28,854 | 35,500 | 43,091 |
| 2010's | 36,239 | 42,913 | 44,732 | 51,678 | 51,724 | 43,277 | 38,300 | 45,239 | 36,111 | 30,249 |
| 2020's | 24,690 |
| - = No Data Reported; -- = Not Applicable; NA = Not Available; W = Withheld to avoid disclosure of individual company data. |
| Release Date: 2/9/2022 |
| Next Release Date: Suspended |