|
Download Data (XLS File) |
|
|||||
|
|||||
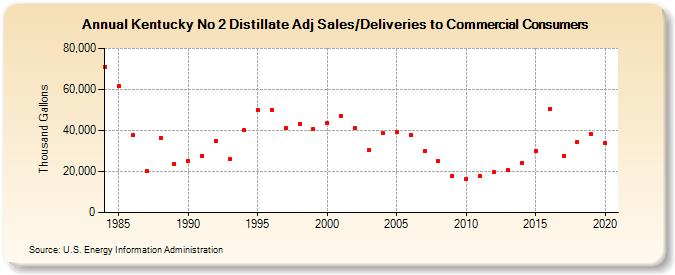
| Kentucky No 2 Distillate Adj Sales/Deliveries to Commercial Consumers (Thousand Gallons) | |||||
| Decade | Year-0 | Year-1 | Year-2 | Year-3 | Year-4 | Year-5 | Year-6 | Year-7 | Year-8 | Year-9 |
|---|---|---|---|---|---|---|---|---|---|---|
| 1980's | 70,709 | 61,619 | 37,984 | 20,017 | 36,525 | 23,871 | ||||
| 1990's | 25,019 | 27,785 | 35,067 | 25,865 | 40,073 | 50,116 | 50,219 | 41,221 | 43,263 | 40,896 |
| 2000's | 43,481 | 47,049 | 41,034 | 30,490 | 38,527 | 39,088 | 37,986 | 29,971 | 25,105 | 17,695 |
| 2010's | 16,405 | 17,718 | 19,569 | 20,837 | 24,139 | 29,853 | 50,499 | 27,581 | 34,310 | 38,422 |
| 2020's | 33,760 |
| - = No Data Reported; -- = Not Applicable; NA = Not Available; W = Withheld to avoid disclosure of individual company data. |
| Release Date: 2/9/2022 |
| Next Release Date: Suspended |