|
Download Data (XLS File) |
|
|||||
|
|||||
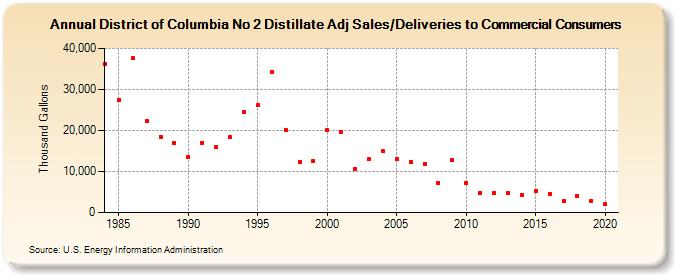
| District of Columbia No 2 Distillate Adj Sales/Deliveries to Commercial Consumers (Thousand Gallons) | |||||
| Decade | Year-0 | Year-1 | Year-2 | Year-3 | Year-4 | Year-5 | Year-6 | Year-7 | Year-8 | Year-9 |
|---|---|---|---|---|---|---|---|---|---|---|
| 1980's | 36,292 | 27,530 | 37,554 | 22,354 | 18,430 | 16,856 | ||||
| 1990's | 13,533 | 17,038 | 15,925 | 18,322 | 24,590 | 26,096 | 34,359 | 20,216 | 12,426 | 12,613 |
| 2000's | 20,167 | 19,681 | 10,700 | 12,975 | 14,905 | 13,036 | 12,332 | 11,806 | 7,281 | 12,773 |
| 2010's | 7,103 | 4,768 | 4,851 | 4,874 | 4,385 | 5,236 | 4,606 | 2,765 | 3,930 | 2,842 |
| 2020's | 2,016 |
| - = No Data Reported; -- = Not Applicable; NA = Not Available; W = Withheld to avoid disclosure of individual company data. |
| Release Date: 2/9/2022 |
| Next Release Date: Suspended |