|
Download Data (XLS File) |
|
|||||
|
|||||
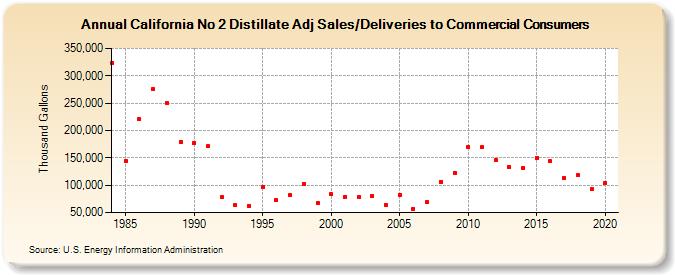
| California No 2 Distillate Adj Sales/Deliveries to Commercial Consumers (Thousand Gallons) | |||||
| Decade | Year-0 | Year-1 | Year-2 | Year-3 | Year-4 | Year-5 | Year-6 | Year-7 | Year-8 | Year-9 |
|---|---|---|---|---|---|---|---|---|---|---|
| 1980's | 324,043 | 144,511 | 220,400 | 275,489 | 250,646 | 178,589 | ||||
| 1990's | 177,426 | 171,576 | 77,628 | 63,303 | 62,678 | 97,579 | 72,768 | 81,930 | 102,303 | 67,910 |
| 2000's | 83,412 | 78,759 | 77,879 | 80,210 | 63,837 | 82,978 | 56,711 | 68,488 | 106,684 | 122,425 |
| 2010's | 170,492 | 169,007 | 146,366 | 133,795 | 132,104 | 150,281 | 143,504 | 113,349 | 117,787 | 93,357 |
| 2020's | 104,527 |
| - = No Data Reported; -- = Not Applicable; NA = Not Available; W = Withheld to avoid disclosure of individual company data. |
| Release Date: 2/9/2022 |
| Next Release Date: Suspended |