|
Download Data (XLS File) |
|
|||||
|
|||||
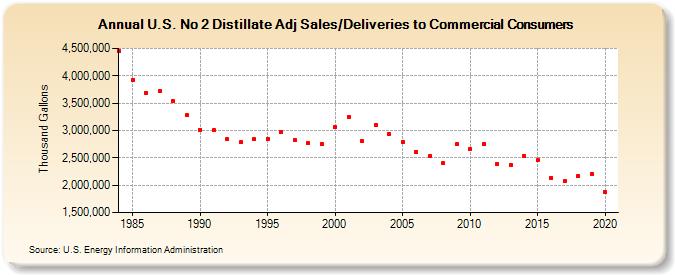
| U.S. No 2 Distillate Adj Sales/Deliveries to Commercial Consumers (Thousand Gallons) | |||||
| Decade | Year-0 | Year-1 | Year-2 | Year-3 | Year-4 | Year-5 | Year-6 | Year-7 | Year-8 | Year-9 |
|---|---|---|---|---|---|---|---|---|---|---|
| 1980's | 4,461,323 | 3,930,266 | 3,693,291 | 3,713,234 | 3,535,624 | 3,282,156 | ||||
| 1990's | 3,015,651 | 3,000,677 | 2,838,671 | 2,783,636 | 2,837,002 | 2,852,948 | 2,964,532 | 2,821,004 | 2,765,366 | 2,757,296 |
| 2000's | 3,066,443 | 3,248,121 | 2,807,616 | 3,102,243 | 2,941,605 | 2,795,593 | 2,610,044 | 2,526,463 | 2,396,852 | 2,744,379 |
| 2010's | 2,665,589 | 2,756,475 | 2,383,248 | 2,375,439 | 2,531,332 | 2,452,456 | 2,138,935 | 2,068,810 | 2,168,730 | 2,208,441 |
| 2020's | 1,880,096 |
| - = No Data Reported; -- = Not Applicable; NA = Not Available; W = Withheld to avoid disclosure of individual company data. |
| Release Date: 2/9/2022 |
| Next Release Date: Suspended |