|
Download Data (XLS File) |
|
|||||
|
|||||
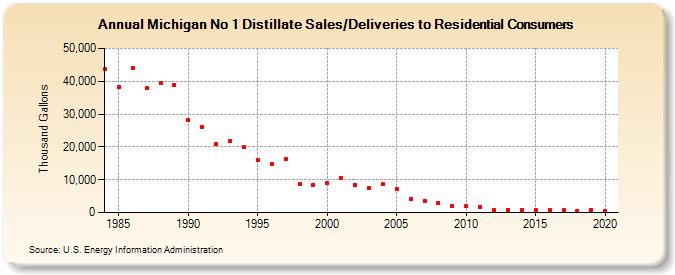
| Michigan No 1 Distillate Sales/Deliveries to Residential Consumers (Thousand Gallons) | |||||
| Decade | Year-0 | Year-1 | Year-2 | Year-3 | Year-4 | Year-5 | Year-6 | Year-7 | Year-8 | Year-9 |
|---|---|---|---|---|---|---|---|---|---|---|
| 1980's | 43,724 | 38,306 | 43,990 | 37,912 | 39,519 | 38,932 | ||||
| 1990's | 28,173 | 26,124 | 20,887 | 21,821 | 19,843 | 16,159 | 14,816 | 16,308 | 8,725 | 8,433 |
| 2000's | 9,058 | 10,399 | 8,396 | 7,338 | 8,577 | 7,194 | 4,263 | 3,447 | 2,989 | 1,954 |
| 2010's | 1,846 | 1,650 | 653 | 837 | 857 | 654 | 802 | 796 | 576 | 754 |
| 2020's | 465 |
| - = No Data Reported; -- = Not Applicable; NA = Not Available; W = Withheld to avoid disclosure of individual company data. |
| Release Date: 2/9/2022 |
| Next Release Date: Suspended |