|
Download Data (XLS File) |
|
|||||
|
|||||
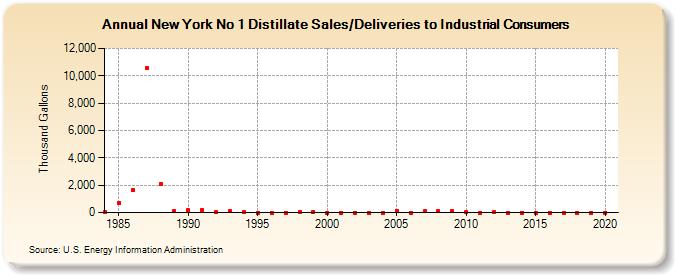
| New York No 1 Distillate Sales/Deliveries to Industrial Consumers (Thousand Gallons) | |||||
| Decade | Year-0 | Year-1 | Year-2 | Year-3 | Year-4 | Year-5 | Year-6 | Year-7 | Year-8 | Year-9 |
|---|---|---|---|---|---|---|---|---|---|---|
| 1980's | 10 | 711 | 1,625 | 10,555 | 2,089 | 114 | ||||
| 1990's | 168 | 215 | 30 | 98 | 9 | 0 | 0 | 0 | 75 | 72 |
| 2000's | 0 | 0 | 0 | 0 | 0 | 124 | 0 | 87 | 107 | 114 |
| 2010's | 7 | 2 | 20 | 0 | 0 | 0 | 0 | 0 | 0 | 0 |
| 2020's | 0 |
| - = No Data Reported; -- = Not Applicable; NA = Not Available; W = Withheld to avoid disclosure of individual company data. |
| Release Date: 2/9/2022 |
| Next Release Date: Suspended |