|
Download Data (XLS File) |
|
|||||
|
|||||
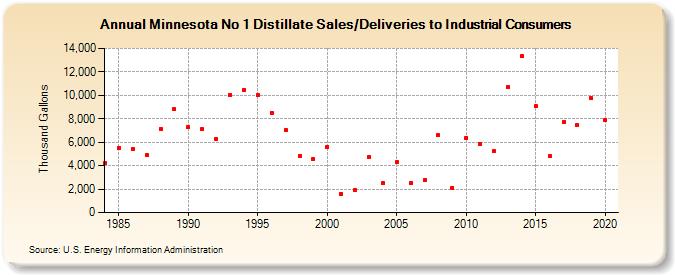
| Minnesota No 1 Distillate Sales/Deliveries to Industrial Consumers (Thousand Gallons) | |||||
| Decade | Year-0 | Year-1 | Year-2 | Year-3 | Year-4 | Year-5 | Year-6 | Year-7 | Year-8 | Year-9 |
|---|---|---|---|---|---|---|---|---|---|---|
| 1980's | 4,225 | 5,515 | 5,419 | 4,928 | 7,148 | 8,789 | ||||
| 1990's | 7,301 | 7,097 | 6,231 | 10,066 | 10,471 | 9,993 | 8,520 | 7,023 | 4,795 | 4,566 |
| 2000's | 5,630 | 1,613 | 1,943 | 4,701 | 2,501 | 4,325 | 2,502 | 2,754 | 6,591 | 2,125 |
| 2010's | 6,390 | 5,865 | 5,218 | 10,705 | 13,314 | 9,080 | 4,801 | 7,711 | 7,440 | 9,756 |
| 2020's | 7,913 |
| - = No Data Reported; -- = Not Applicable; NA = Not Available; W = Withheld to avoid disclosure of individual company data. |
| Release Date: 2/9/2022 |
| Next Release Date: Suspended |