|
Download Data (XLS File) |
|
|||||
|
|||||
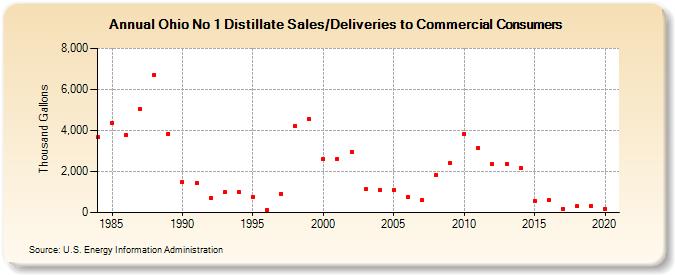
| Ohio No 1 Distillate Sales/Deliveries to Commercial Consumers (Thousand Gallons) | |||||
| Decade | Year-0 | Year-1 | Year-2 | Year-3 | Year-4 | Year-5 | Year-6 | Year-7 | Year-8 | Year-9 |
|---|---|---|---|---|---|---|---|---|---|---|
| 1980's | 3,661 | 4,372 | 3,786 | 5,053 | 6,720 | 3,852 | ||||
| 1990's | 1,481 | 1,442 | 698 | 991 | 1,009 | 772 | 131 | 926 | 4,227 | 4,565 |
| 2000's | 2,588 | 2,617 | 2,970 | 1,124 | 1,095 | 1,121 | 780 | 623 | 1,835 | 2,435 |
| 2010's | 3,845 | 3,160 | 2,364 | 2,384 | 2,177 | 586 | 590 | 197 | 301 | 328 |
| 2020's | 188 |
| - = No Data Reported; -- = Not Applicable; NA = Not Available; W = Withheld to avoid disclosure of individual company data. |
| Release Date: 2/9/2022 |
| Next Release Date: Suspended |