|
Download Data (XLS File) |
|
|||||
|
|||||
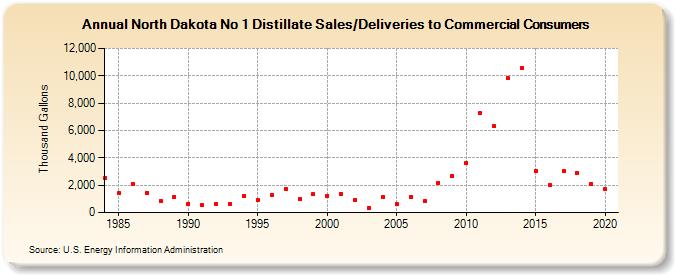
| North Dakota No 1 Distillate Sales/Deliveries to Commercial Consumers (Thousand Gallons) | |||||
| Decade | Year-0 | Year-1 | Year-2 | Year-3 | Year-4 | Year-5 | Year-6 | Year-7 | Year-8 | Year-9 |
|---|---|---|---|---|---|---|---|---|---|---|
| 1980's | 2,542 | 1,427 | 2,109 | 1,456 | 862 | 1,142 | ||||
| 1990's | 649 | 533 | 649 | 655 | 1,200 | 936 | 1,314 | 1,752 | 1,009 | 1,330 |
| 2000's | 1,237 | 1,362 | 947 | 350 | 1,122 | 624 | 1,173 | 828 | 2,188 | 2,687 |
| 2010's | 3,619 | 7,274 | 6,313 | 9,807 | 10,598 | 3,046 | 2,017 | 3,049 | 2,862 | 2,104 |
| 2020's | 1,719 |
| - = No Data Reported; -- = Not Applicable; NA = Not Available; W = Withheld to avoid disclosure of individual company data. |
| Release Date: 2/9/2022 |
| Next Release Date: Suspended |