|
Download Data (XLS File) |
|
|||||
|
|||||
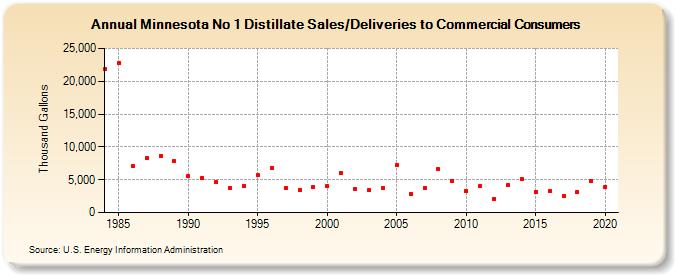
| Minnesota No 1 Distillate Sales/Deliveries to Commercial Consumers (Thousand Gallons) | |||||
| Decade | Year-0 | Year-1 | Year-2 | Year-3 | Year-4 | Year-5 | Year-6 | Year-7 | Year-8 | Year-9 |
|---|---|---|---|---|---|---|---|---|---|---|
| 1980's | 21,828 | 22,751 | 7,031 | 8,240 | 8,597 | 7,841 | ||||
| 1990's | 5,537 | 5,265 | 4,688 | 3,797 | 4,104 | 5,666 | 6,812 | 3,759 | 3,434 | 3,909 |
| 2000's | 4,011 | 6,024 | 3,622 | 3,376 | 3,757 | 7,261 | 2,848 | 3,766 | 6,587 | 4,730 |
| 2010's | 3,301 | 4,048 | 2,101 | 4,183 | 5,105 | 3,182 | 3,297 | 2,464 | 3,121 | 4,846 |
| 2020's | 3,893 |
| - = No Data Reported; -- = Not Applicable; NA = Not Available; W = Withheld to avoid disclosure of individual company data. |
| Release Date: 2/9/2022 |
| Next Release Date: Suspended |