|
Download Data (XLS File) |
|
|||||
|
|||||
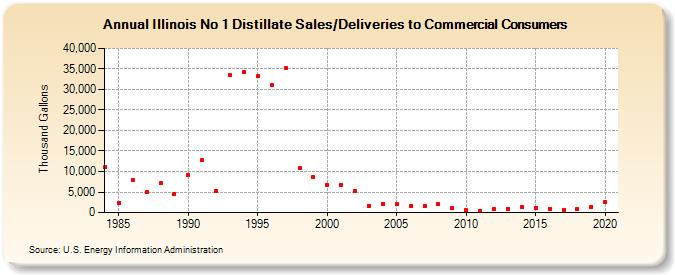
| Illinois No 1 Distillate Sales/Deliveries to Commercial Consumers (Thousand Gallons) | |||||
| Decade | Year-0 | Year-1 | Year-2 | Year-3 | Year-4 | Year-5 | Year-6 | Year-7 | Year-8 | Year-9 |
|---|---|---|---|---|---|---|---|---|---|---|
| 1980's | 11,020 | 2,340 | 7,822 | 5,097 | 7,105 | 4,596 | ||||
| 1990's | 9,243 | 12,725 | 5,354 | 33,477 | 34,199 | 33,199 | 30,978 | 35,169 | 10,765 | 8,649 |
| 2000's | 6,747 | 6,648 | 5,371 | 1,695 | 2,112 | 2,070 | 1,616 | 1,551 | 2,012 | 1,132 |
| 2010's | 590 | 469 | 772 | 933 | 1,329 | 1,078 | 937 | 605 | 843 | 1,398 |
| 2020's | 2,635 |
| - = No Data Reported; -- = Not Applicable; NA = Not Available; W = Withheld to avoid disclosure of individual company data. |
| Release Date: 2/9/2022 |
| Next Release Date: Suspended |