|
Download Data (XLS File) |
|
|||||
|
|||||
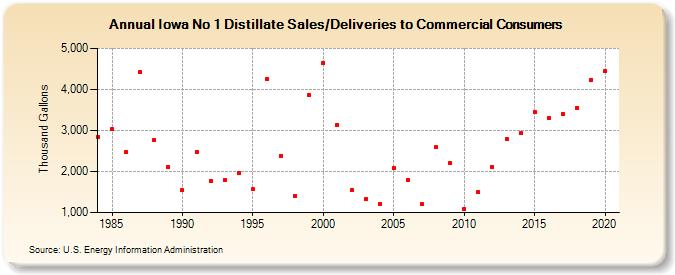
| Iowa No 1 Distillate Sales/Deliveries to Commercial Consumers (Thousand Gallons) | |||||
| Decade | Year-0 | Year-1 | Year-2 | Year-3 | Year-4 | Year-5 | Year-6 | Year-7 | Year-8 | Year-9 |
|---|---|---|---|---|---|---|---|---|---|---|
| 1980's | 2,848 | 3,033 | 2,478 | 4,430 | 2,768 | 2,106 | ||||
| 1990's | 1,542 | 2,474 | 1,779 | 1,793 | 1,968 | 1,563 | 4,248 | 2,390 | 1,404 | 3,862 |
| 2000's | 4,642 | 3,131 | 1,539 | 1,327 | 1,206 | 2,082 | 1,789 | 1,202 | 2,588 | 2,209 |
| 2010's | 1,079 | 1,499 | 2,112 | 2,804 | 2,931 | 3,447 | 3,297 | 3,401 | 3,554 | 4,240 |
| 2020's | 4,437 |
| - = No Data Reported; -- = Not Applicable; NA = Not Available; W = Withheld to avoid disclosure of individual company data. |
| Release Date: 2/9/2022 |
| Next Release Date: Suspended |