|
Download Data (XLS File) |
|
|||||
|
|||||
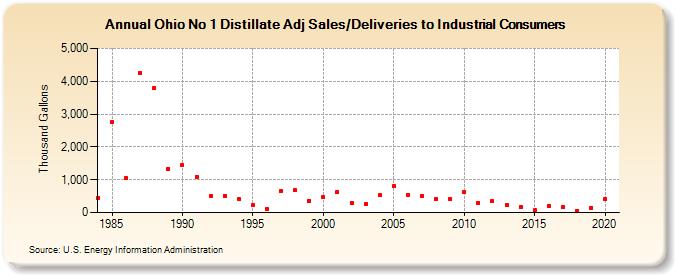
| Ohio No 1 Distillate Adj Sales/Deliveries to Industrial Consumers (Thousand Gallons) | |||||
| Decade | Year-0 | Year-1 | Year-2 | Year-3 | Year-4 | Year-5 | Year-6 | Year-7 | Year-8 | Year-9 |
|---|---|---|---|---|---|---|---|---|---|---|
| 1980's | 451 | 2,760 | 1,061 | 4,262 | 3,802 | 1,341 | ||||
| 1990's | 1,449 | 1,091 | 513 | 515 | 409 | 226 | 114 | 664 | 677 | 362 |
| 2000's | 465 | 619 | 290 | 263 | 534 | 802 | 541 | 511 | 399 | 411 |
| 2010's | 628 | 305 | 344 | 239 | 173 | 66 | 208 | 161 | 57 | 148 |
| 2020's | 406 |
| - = No Data Reported; -- = Not Applicable; NA = Not Available; W = Withheld to avoid disclosure of individual company data. |
| Release Date: 2/9/2022 |
| Next Release Date: Suspended |