|
Download Data (XLS File) |
|
|||||
|
|||||
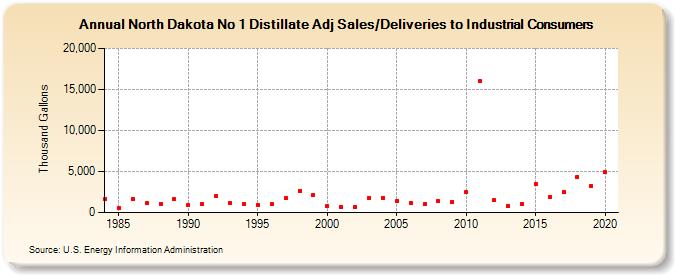
| North Dakota No 1 Distillate Adj Sales/Deliveries to Industrial Consumers (Thousand Gallons) | |||||
| Decade | Year-0 | Year-1 | Year-2 | Year-3 | Year-4 | Year-5 | Year-6 | Year-7 | Year-8 | Year-9 |
|---|---|---|---|---|---|---|---|---|---|---|
| 1980's | 1,641 | 573 | 1,622 | 1,108 | 1,067 | 1,602 | ||||
| 1990's | 885 | 996 | 2,015 | 1,172 | 1,002 | 956 | 993 | 1,761 | 2,680 | 2,164 |
| 2000's | 775 | 687 | 653 | 1,796 | 1,821 | 1,404 | 1,217 | 1,008 | 1,375 | 1,332 |
| 2010's | 2,472 | 16,012 | 1,526 | 773 | 1,091 | 3,426 | 1,920 | 2,478 | 4,340 | 3,240 |
| 2020's | 4,886 |
| - = No Data Reported; -- = Not Applicable; NA = Not Available; W = Withheld to avoid disclosure of individual company data. |
| Release Date: 2/9/2022 |
| Next Release Date: Suspended |