|
Download Data (XLS File) |
|
|||||
|
|||||
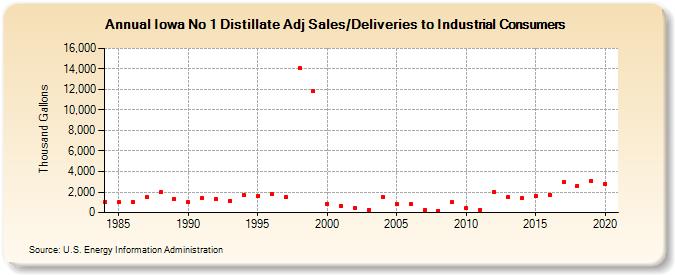
| Iowa No 1 Distillate Adj Sales/Deliveries to Industrial Consumers (Thousand Gallons) | |||||
| Decade | Year-0 | Year-1 | Year-2 | Year-3 | Year-4 | Year-5 | Year-6 | Year-7 | Year-8 | Year-9 |
|---|---|---|---|---|---|---|---|---|---|---|
| 1980's | 1,042 | 997 | 1,046 | 1,468 | 1,958 | 1,308 | ||||
| 1990's | 984 | 1,462 | 1,312 | 1,173 | 1,697 | 1,593 | 1,763 | 1,509 | 14,058 | 11,822 |
| 2000's | 845 | 618 | 470 | 294 | 1,504 | 839 | 831 | 239 | 191 | 992 |
| 2010's | 441 | 298 | 2,017 | 1,498 | 1,384 | 1,615 | 1,748 | 2,971 | 2,590 | 3,093 |
| 2020's | 2,818 |
| - = No Data Reported; -- = Not Applicable; NA = Not Available; W = Withheld to avoid disclosure of individual company data. |
| Release Date: 2/9/2022 |
| Next Release Date: Suspended |