|
Download Data (XLS File) |
|
|||||
|
|||||
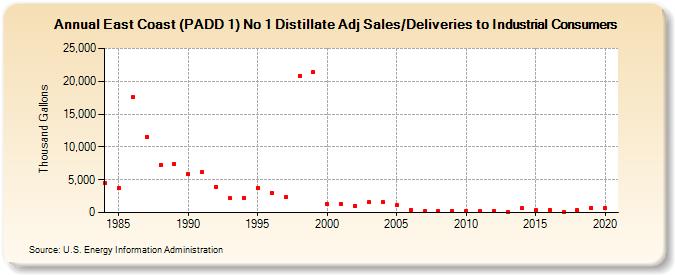
| East Coast (PADD 1) No 1 Distillate Adj Sales/Deliveries to Industrial Consumers (Thousand Gallons) | |||||
| Decade | Year-0 | Year-1 | Year-2 | Year-3 | Year-4 | Year-5 | Year-6 | Year-7 | Year-8 | Year-9 |
|---|---|---|---|---|---|---|---|---|---|---|
| 1980's | 4,513 | 3,717 | 17,567 | 11,548 | 7,259 | 7,443 | ||||
| 1990's | 5,835 | 6,121 | 3,939 | 2,172 | 2,285 | 3,784 | 3,025 | 2,357 | 20,856 | 21,337 |
| 2000's | 1,261 | 1,337 | 973 | 1,566 | 1,571 | 1,093 | 375 | 186 | 201 | 254 |
| 2010's | 297 | 162 | 263 | 66 | 684 | 334 | 444 | 51 | 345 | 733 |
| 2020's | 700 |
| - = No Data Reported; -- = Not Applicable; NA = Not Available; W = Withheld to avoid disclosure of individual company data. |
| Release Date: 2/9/2022 |
| Next Release Date: Suspended |