|
Download Data (XLS File) |
|
|||||
|
|||||
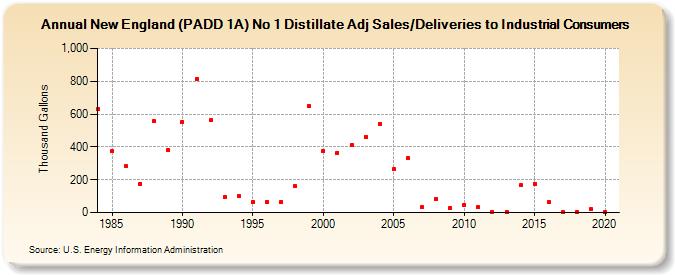
| New England (PADD 1A) No 1 Distillate Adj Sales/Deliveries to Industrial Consumers (Thousand Gallons) | |||||
| Decade | Year-0 | Year-1 | Year-2 | Year-3 | Year-4 | Year-5 | Year-6 | Year-7 | Year-8 | Year-9 |
|---|---|---|---|---|---|---|---|---|---|---|
| 1980's | 629 | 372 | 282 | 177 | 557 | 380 | ||||
| 1990's | 553 | 815 | 562 | 94 | 98 | 66 | 64 | 63 | 161 | 647 |
| 2000's | 378 | 365 | 412 | 463 | 538 | 263 | 330 | 32 | 84 | 28 |
| 2010's | 49 | 31 | 4 | 5 | 166 | 176 | 62 | 3 | 3 | 20 |
| 2020's | 5 |
| - = No Data Reported; -- = Not Applicable; NA = Not Available; W = Withheld to avoid disclosure of individual company data. |
| Release Date: 2/9/2022 |
| Next Release Date: Suspended |