|
Download Data (XLS File) |
|
|||||
|
|||||
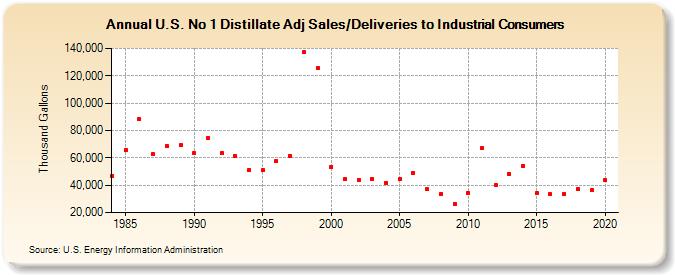
| U.S. No 1 Distillate Adj Sales/Deliveries to Industrial Consumers (Thousand Gallons) | |||||
| Decade | Year-0 | Year-1 | Year-2 | Year-3 | Year-4 | Year-5 | Year-6 | Year-7 | Year-8 | Year-9 |
|---|---|---|---|---|---|---|---|---|---|---|
| 1980's | 46,503 | 65,624 | 88,167 | 62,570 | 68,476 | 69,337 | ||||
| 1990's | 63,366 | 74,679 | 63,218 | 61,223 | 51,026 | 50,898 | 57,658 | 61,400 | 137,154 | 125,782 |
| 2000's | 53,561 | 44,304 | 43,891 | 44,854 | 41,619 | 44,330 | 49,194 | 36,901 | 33,416 | 26,293 |
| 2010's | 34,409 | 67,356 | 40,243 | 48,207 | 54,105 | 34,048 | 33,247 | 33,398 | 36,893 | 36,478 |
| 2020's | 43,486 |
| - = No Data Reported; -- = Not Applicable; NA = Not Available; W = Withheld to avoid disclosure of individual company data. |
| Release Date: 2/9/2022 |
| Next Release Date: Suspended |