|
Download Data (XLS File) |
|
|||||
|
|||||
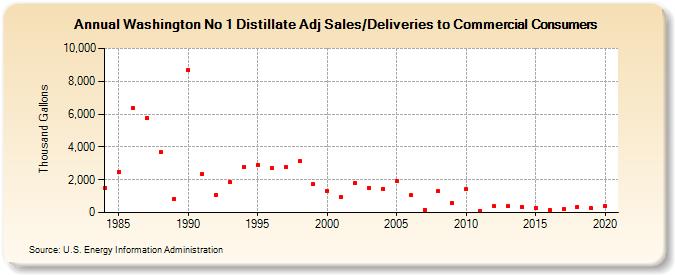
| Washington No 1 Distillate Adj Sales/Deliveries to Commercial Consumers (Thousand Gallons) | |||||
| Decade | Year-0 | Year-1 | Year-2 | Year-3 | Year-4 | Year-5 | Year-6 | Year-7 | Year-8 | Year-9 |
|---|---|---|---|---|---|---|---|---|---|---|
| 1980's | 1,521 | 2,499 | 6,361 | 5,753 | 3,697 | 834 | ||||
| 1990's | 8,686 | 2,370 | 1,084 | 1,837 | 2,802 | 2,919 | 2,699 | 2,771 | 3,113 | 1,723 |
| 2000's | 1,333 | 933 | 1,790 | 1,510 | 1,455 | 1,949 | 1,047 | 185 | 1,289 | 588 |
| 2010's | 1,416 | 89 | 376 | 382 | 339 | 259 | 169 | 223 | 367 | 250 |
| 2020's | 393 |
| - = No Data Reported; -- = Not Applicable; NA = Not Available; W = Withheld to avoid disclosure of individual company data. |
| Release Date: 2/9/2022 |
| Next Release Date: Suspended |