|
Download Data (XLS File) |
|
|||||
|
|||||
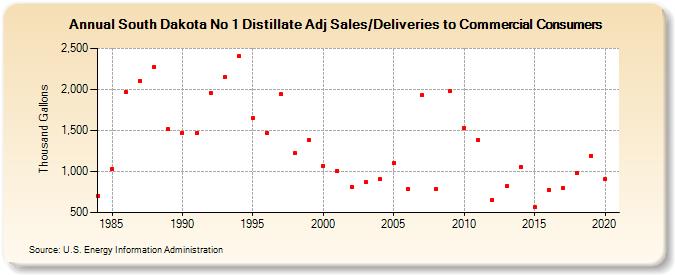
| South Dakota No 1 Distillate Adj Sales/Deliveries to Commercial Consumers (Thousand Gallons) | |||||
| Decade | Year-0 | Year-1 | Year-2 | Year-3 | Year-4 | Year-5 | Year-6 | Year-7 | Year-8 | Year-9 |
|---|---|---|---|---|---|---|---|---|---|---|
| 1980's | 705 | 1,036 | 1,968 | 2,107 | 2,278 | 1,512 | ||||
| 1990's | 1,472 | 1,464 | 1,961 | 2,146 | 2,406 | 1,646 | 1,467 | 1,939 | 1,223 | 1,387 |
| 2000's | 1,073 | 1,011 | 812 | 872 | 907 | 1,106 | 792 | 1,933 | 788 | 1,978 |
| 2010's | 1,529 | 1,389 | 659 | 820 | 1,058 | 563 | 778 | 797 | 987 | 1,193 |
| 2020's | 904 |
| - = No Data Reported; -- = Not Applicable; NA = Not Available; W = Withheld to avoid disclosure of individual company data. |
| Release Date: 2/9/2022 |
| Next Release Date: Suspended |