|
Download Data (XLS File) |
|
|||||
|
|||||
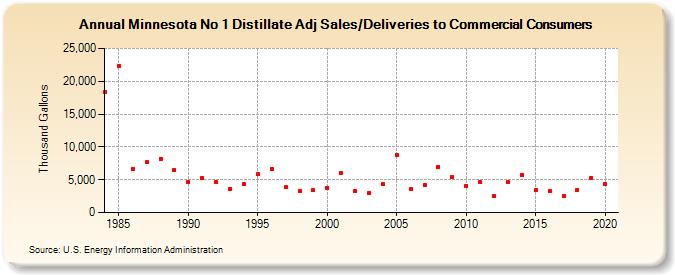
| Minnesota No 1 Distillate Adj Sales/Deliveries to Commercial Consumers (Thousand Gallons) | |||||
| Decade | Year-0 | Year-1 | Year-2 | Year-3 | Year-4 | Year-5 | Year-6 | Year-7 | Year-8 | Year-9 |
|---|---|---|---|---|---|---|---|---|---|---|
| 1980's | 18,347 | 22,384 | 6,608 | 7,625 | 8,222 | 6,508 | ||||
| 1990's | 4,608 | 5,223 | 4,579 | 3,644 | 4,306 | 5,830 | 6,677 | 3,843 | 3,232 | 3,370 |
| 2000's | 3,745 | 6,009 | 3,228 | 3,015 | 4,303 | 8,765 | 3,568 | 4,142 | 6,994 | 5,383 |
| 2010's | 4,071 | 4,580 | 2,464 | 4,657 | 5,739 | 3,376 | 3,304 | 2,506 | 3,439 | 5,287 |
| 2020's | 4,297 |
| - = No Data Reported; -- = Not Applicable; NA = Not Available; W = Withheld to avoid disclosure of individual company data. |
| Release Date: 2/9/2022 |
| Next Release Date: Suspended |