|
Download Data (XLS File) |
|
|||||
|
|||||
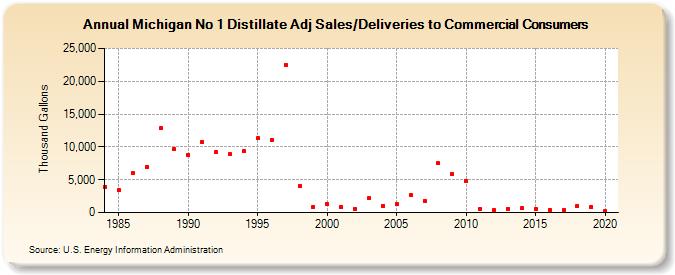
| Michigan No 1 Distillate Adj Sales/Deliveries to Commercial Consumers (Thousand Gallons) | |||||
| Decade | Year-0 | Year-1 | Year-2 | Year-3 | Year-4 | Year-5 | Year-6 | Year-7 | Year-8 | Year-9 |
|---|---|---|---|---|---|---|---|---|---|---|
| 1980's | 3,947 | 3,435 | 5,971 | 7,000 | 12,833 | 9,645 | ||||
| 1990's | 8,757 | 10,744 | 9,154 | 8,848 | 9,331 | 11,278 | 11,093 | 22,515 | 4,067 | 853 |
| 2000's | 1,243 | 822 | 577 | 2,185 | 1,061 | 1,295 | 2,687 | 1,779 | 7,493 | 5,855 |
| 2010's | 4,835 | 552 | 322 | 581 | 650 | 517 | 453 | 402 | 984 | 882 |
| 2020's | 209 |
| - = No Data Reported; -- = Not Applicable; NA = Not Available; W = Withheld to avoid disclosure of individual company data. |
| Release Date: 2/9/2022 |
| Next Release Date: Suspended |