|
Download Data (XLS File) |
|
|||||
|
|||||
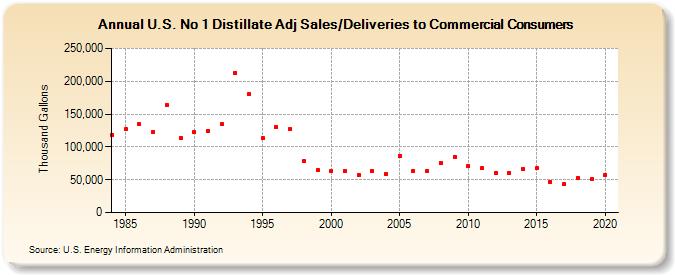
| U.S. No 1 Distillate Adj Sales/Deliveries to Commercial Consumers (Thousand Gallons) | |||||
| Decade | Year-0 | Year-1 | Year-2 | Year-3 | Year-4 | Year-5 | Year-6 | Year-7 | Year-8 | Year-9 |
|---|---|---|---|---|---|---|---|---|---|---|
| 1980's | 118,157 | 126,555 | 134,339 | 122,443 | 163,992 | 113,648 | ||||
| 1990's | 123,022 | 124,008 | 134,406 | 212,913 | 180,230 | 113,399 | 130,221 | 127,043 | 77,915 | 64,456 |
| 2000's | 62,637 | 63,629 | 57,585 | 63,789 | 58,877 | 86,669 | 63,820 | 63,974 | 75,904 | 84,757 |
| 2010's | 71,459 | 67,111 | 60,794 | 60,624 | 66,462 | 67,362 | 47,057 | 42,875 | 52,757 | 50,986 |
| 2020's | 57,319 |
| - = No Data Reported; -- = Not Applicable; NA = Not Available; W = Withheld to avoid disclosure of individual company data. |
| Release Date: 2/9/2022 |
| Next Release Date: Suspended |