|
Download Data (XLS File) |
|
|||||
|
|||||
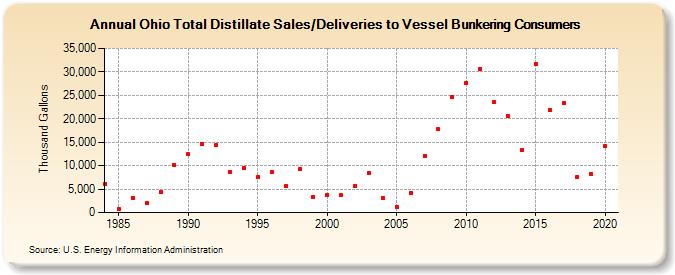
| Ohio Total Distillate Sales/Deliveries to Vessel Bunkering Consumers (Thousand Gallons) | |||||
| Decade | Year-0 | Year-1 | Year-2 | Year-3 | Year-4 | Year-5 | Year-6 | Year-7 | Year-8 | Year-9 |
|---|---|---|---|---|---|---|---|---|---|---|
| 1980's | 6,108 | 785 | 3,166 | 2,001 | 4,402 | 10,171 | ||||
| 1990's | 12,409 | 14,645 | 14,387 | 8,702 | 9,532 | 7,553 | 8,619 | 5,749 | 9,191 | 3,389 |
| 2000's | 3,809 | 3,647 | 5,690 | 8,440 | 3,104 | 1,182 | 4,217 | 12,122 | 17,733 | 24,586 |
| 2010's | 27,668 | 30,684 | 23,532 | 20,550 | 13,338 | 31,586 | 21,855 | 23,283 | 7,533 | 8,187 |
| 2020's | 14,104 |
| - = No Data Reported; -- = Not Applicable; NA = Not Available; W = Withheld to avoid disclosure of individual company data. |
| Release Date: 2/9/2022 |
| Next Release Date: Suspended |