|
Download Data (XLS File) |
|
|||||
|
|||||
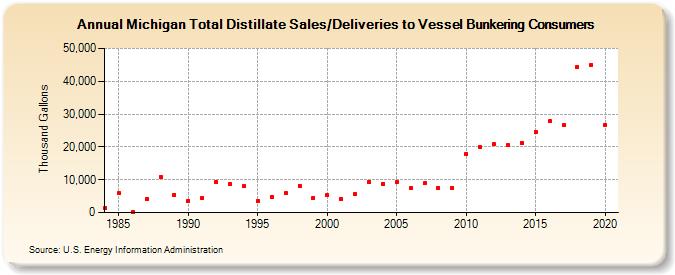
| Michigan Total Distillate Sales/Deliveries to Vessel Bunkering Consumers (Thousand Gallons) | |||||
| Decade | Year-0 | Year-1 | Year-2 | Year-3 | Year-4 | Year-5 | Year-6 | Year-7 | Year-8 | Year-9 |
|---|---|---|---|---|---|---|---|---|---|---|
| 1980's | 1,417 | 5,842 | 248 | 4,251 | 10,847 | 5,491 | ||||
| 1990's | 3,653 | 4,503 | 9,286 | 8,641 | 8,009 | 3,672 | 4,850 | 5,817 | 8,241 | 4,572 |
| 2000's | 5,244 | 4,172 | 5,515 | 9,453 | 8,792 | 9,282 | 7,418 | 8,900 | 7,585 | 7,585 |
| 2010's | 17,875 | 19,825 | 20,792 | 20,445 | 21,192 | 24,530 | 27,770 | 26,650 | 44,404 | 45,085 |
| 2020's | 26,776 |
| - = No Data Reported; -- = Not Applicable; NA = Not Available; W = Withheld to avoid disclosure of individual company data. |
| Release Date: 2/9/2022 |
| Next Release Date: Suspended |