|
Download Data (XLS File) |
|
|||||
|
|||||
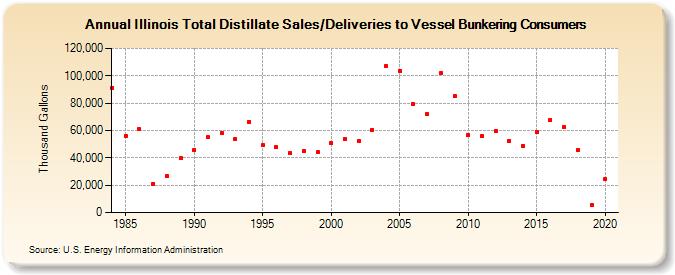
| Illinois Total Distillate Sales/Deliveries to Vessel Bunkering Consumers (Thousand Gallons) | |||||
| Decade | Year-0 | Year-1 | Year-2 | Year-3 | Year-4 | Year-5 | Year-6 | Year-7 | Year-8 | Year-9 |
|---|---|---|---|---|---|---|---|---|---|---|
| 1980's | 91,357 | 56,094 | 60,753 | 21,216 | 26,588 | 39,678 | ||||
| 1990's | 45,877 | 54,882 | 58,141 | 53,930 | 66,428 | 49,141 | 47,864 | 43,711 | 44,684 | 44,071 |
| 2000's | 50,480 | 53,791 | 51,965 | 60,365 | 107,110 | 103,673 | 79,326 | 71,805 | 101,851 | 85,117 |
| 2010's | 56,575 | 56,000 | 59,508 | 52,577 | 48,968 | 59,156 | 67,863 | 62,404 | 45,908 | 5,704 |
| 2020's | 24,310 |
| - = No Data Reported; -- = Not Applicable; NA = Not Available; W = Withheld to avoid disclosure of individual company data. |
| Release Date: 2/9/2022 |
| Next Release Date: Suspended |