|
Download Data (XLS File) |
|
|||||
|
|||||
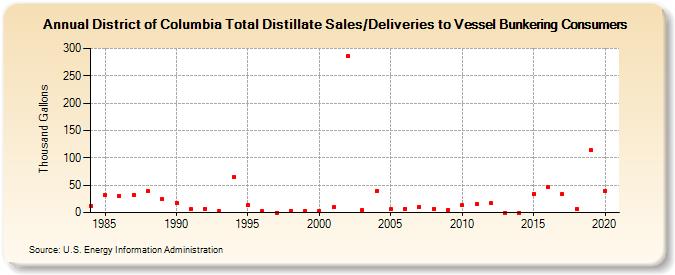
| District of Columbia Total Distillate Sales/Deliveries to Vessel Bunkering Consumers (Thousand Gallons) | |||||
| Decade | Year-0 | Year-1 | Year-2 | Year-3 | Year-4 | Year-5 | Year-6 | Year-7 | Year-8 | Year-9 |
|---|---|---|---|---|---|---|---|---|---|---|
| 1980's | 12 | 32 | 31 | 33 | 39 | 25 | ||||
| 1990's | 18 | 6 | 7 | 2 | 65 | 13 | 2 | 0 | 3 | 3 |
| 2000's | 3 | 10 | 286 | 4 | 39 | 6 | 7 | 11 | 7 | 5 |
| 2010's | 13 | 15 | 17 | 0 | 0 | 34 | 46 | 34 | 7 | 114 |
| 2020's | 40 |
| - = No Data Reported; -- = Not Applicable; NA = Not Available; W = Withheld to avoid disclosure of individual company data. |
| Release Date: 2/9/2022 |
| Next Release Date: Suspended |