|
Download Data (XLS File) |
|
|||||
|
|||||
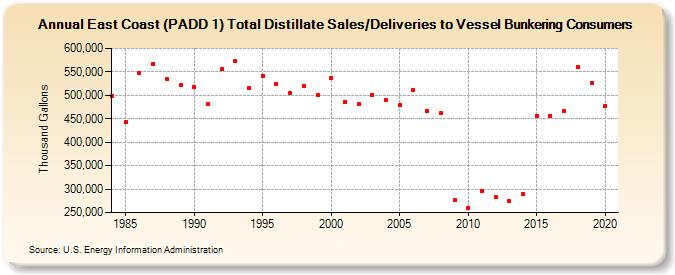
| East Coast (PADD 1) Total Distillate Sales/Deliveries to Vessel Bunkering Consumers (Thousand Gallons) | |||||
| Decade | Year-0 | Year-1 | Year-2 | Year-3 | Year-4 | Year-5 | Year-6 | Year-7 | Year-8 | Year-9 |
|---|---|---|---|---|---|---|---|---|---|---|
| 1980's | 499,000 | 442,695 | 547,280 | 567,630 | 534,979 | 521,110 | ||||
| 1990's | 517,875 | 481,624 | 556,892 | 572,817 | 516,082 | 541,806 | 523,630 | 505,046 | 520,608 | 501,069 |
| 2000's | 536,999 | 486,383 | 481,186 | 501,343 | 489,921 | 478,783 | 510,349 | 466,132 | 461,533 | 276,013 |
| 2010's | 259,319 | 296,947 | 283,254 | 274,142 | 289,674 | 454,982 | 456,872 | 466,335 | 560,462 | 526,603 |
| 2020's | 476,694 |
| - = No Data Reported; -- = Not Applicable; NA = Not Available; W = Withheld to avoid disclosure of individual company data. |
| Release Date: 2/9/2022 |
| Next Release Date: Suspended |