|
Download Data (XLS File) |
|
|||||
|
|||||
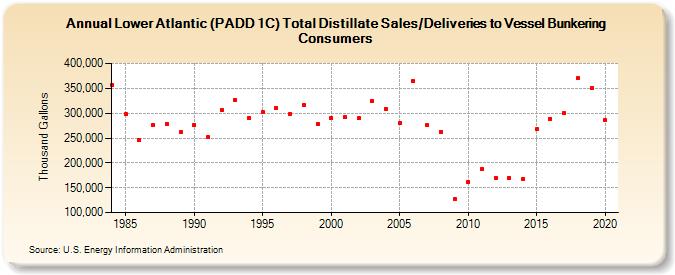
| Lower Atlantic (PADD 1C) Total Distillate Sales/Deliveries to Vessel Bunkering Consumers (Thousand Gallons) | |||||
| Decade | Year-0 | Year-1 | Year-2 | Year-3 | Year-4 | Year-5 | Year-6 | Year-7 | Year-8 | Year-9 |
|---|---|---|---|---|---|---|---|---|---|---|
| 1980's | 357,691 | 297,743 | 246,331 | 275,459 | 278,520 | 261,312 | ||||
| 1990's | 275,796 | 251,325 | 307,356 | 327,218 | 291,037 | 301,400 | 309,504 | 299,321 | 317,174 | 278,898 |
| 2000's | 291,213 | 291,593 | 289,337 | 324,866 | 308,863 | 279,872 | 363,898 | 275,489 | 262,642 | 126,379 |
| 2010's | 161,005 | 188,087 | 170,209 | 170,201 | 168,058 | 267,943 | 288,792 | 300,850 | 369,826 | 349,870 |
| 2020's | 285,281 |
| - = No Data Reported; -- = Not Applicable; NA = Not Available; W = Withheld to avoid disclosure of individual company data. |
| Release Date: 2/9/2022 |
| Next Release Date: Suspended |