|
Download Data (XLS File) |
|
|||||
|
|||||
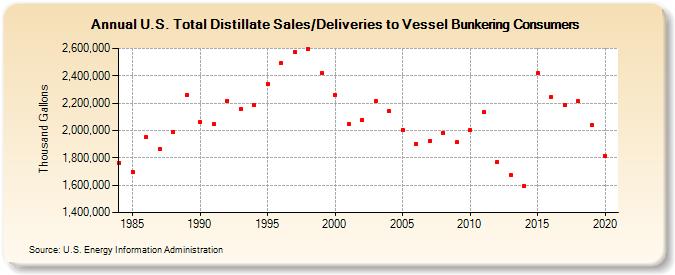
| U.S. Total Distillate Sales/Deliveries to Vessel Bunkering Consumers (Thousand Gallons) | |||||
| Decade | Year-0 | Year-1 | Year-2 | Year-3 | Year-4 | Year-5 | Year-6 | Year-7 | Year-8 | Year-9 |
|---|---|---|---|---|---|---|---|---|---|---|
| 1980's | 1,763,782 | 1,698,985 | 1,949,423 | 1,864,992 | 1,991,773 | 2,258,465 | ||||
| 1990's | 2,064,842 | 2,046,064 | 2,218,592 | 2,154,757 | 2,189,346 | 2,339,010 | 2,490,793 | 2,573,800 | 2,595,076 | 2,419,336 |
| 2000's | 2,261,422 | 2,044,049 | 2,078,921 | 2,216,921 | 2,139,643 | 2,005,564 | 1,903,138 | 1,923,981 | 1,983,422 | 1,912,984 |
| 2010's | 2,002,834 | 2,133,395 | 1,768,324 | 1,675,521 | 1,593,398 | 2,417,303 | 2,245,318 | 2,185,638 | 2,212,643 | 2,041,910 |
| 2020's | 1,816,864 |
| - = No Data Reported; -- = Not Applicable; NA = Not Available; W = Withheld to avoid disclosure of individual company data. |
| Release Date: 2/9/2022 |
| Next Release Date: Suspended |