|
Download Data (XLS File) |
|
|||||
|
|||||
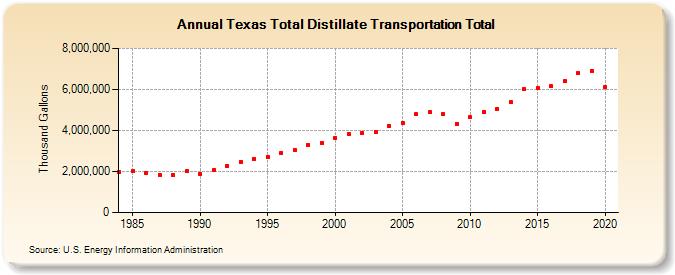
| Texas Total Distillate Transportation Total (Thousand Gallons) | |||||
| Decade | Year-0 | Year-1 | Year-2 | Year-3 | Year-4 | Year-5 | Year-6 | Year-7 | Year-8 | Year-9 |
|---|---|---|---|---|---|---|---|---|---|---|
| 1980's | 1,993,785 | 2,007,739 | 1,941,698 | 1,850,079 | 1,823,679 | 2,009,402 | ||||
| 1990's | 1,895,364 | 2,071,960 | 2,277,476 | 2,483,991 | 2,632,697 | 2,723,789 | 2,916,011 | 3,052,752 | 3,310,971 | 3,412,192 |
| 2000's | 3,642,211 | 3,820,753 | 3,885,264 | 3,938,647 | 4,210,737 | 4,357,143 | 4,797,621 | 4,888,986 | 4,785,480 | 4,338,824 |
| 2010's | 4,640,272 | 4,919,086 | 5,069,496 | 5,386,073 | 6,032,913 | 6,072,486 | 6,149,804 | 6,394,427 | 6,806,795 | 6,921,881 |
| 2020's | 6,101,217 |
| - = No Data Reported; -- = Not Applicable; NA = Not Available; W = Withheld to avoid disclosure of individual company data. |
| Release Date: 2/9/2022 |
| Next Release Date: Suspended |