|
Download Data (XLS File) |
|
|||||
|
|||||
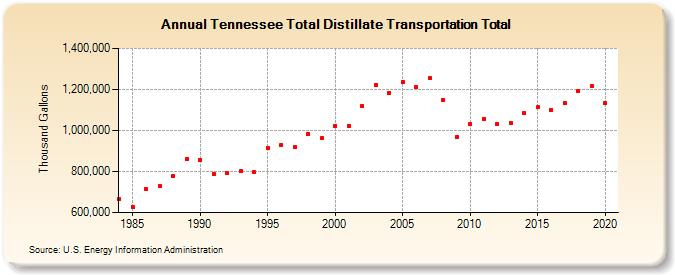
| Tennessee Total Distillate Transportation Total (Thousand Gallons) | |||||
| Decade | Year-0 | Year-1 | Year-2 | Year-3 | Year-4 | Year-5 | Year-6 | Year-7 | Year-8 | Year-9 |
|---|---|---|---|---|---|---|---|---|---|---|
| 1980's | 666,506 | 627,649 | 713,979 | 731,652 | 775,780 | 860,068 | ||||
| 1990's | 857,584 | 787,743 | 791,100 | 800,701 | 797,386 | 913,101 | 931,586 | 919,916 | 983,515 | 962,029 |
| 2000's | 1,023,636 | 1,021,163 | 1,119,624 | 1,220,981 | 1,184,078 | 1,237,163 | 1,210,138 | 1,253,336 | 1,150,322 | 967,780 |
| 2010's | 1,031,755 | 1,056,299 | 1,030,852 | 1,037,856 | 1,084,232 | 1,111,962 | 1,100,706 | 1,134,053 | 1,193,073 | 1,214,690 |
| 2020's | 1,132,351 |
| - = No Data Reported; -- = Not Applicable; NA = Not Available; W = Withheld to avoid disclosure of individual company data. |
| Release Date: 2/9/2022 |
| Next Release Date: Suspended |